Pipelines
The Pipelines page lists all pipelines in the currently selected environment. From here you can create, clone, promote, and delete pipelines, as well as monitor their live throughput at a glance.
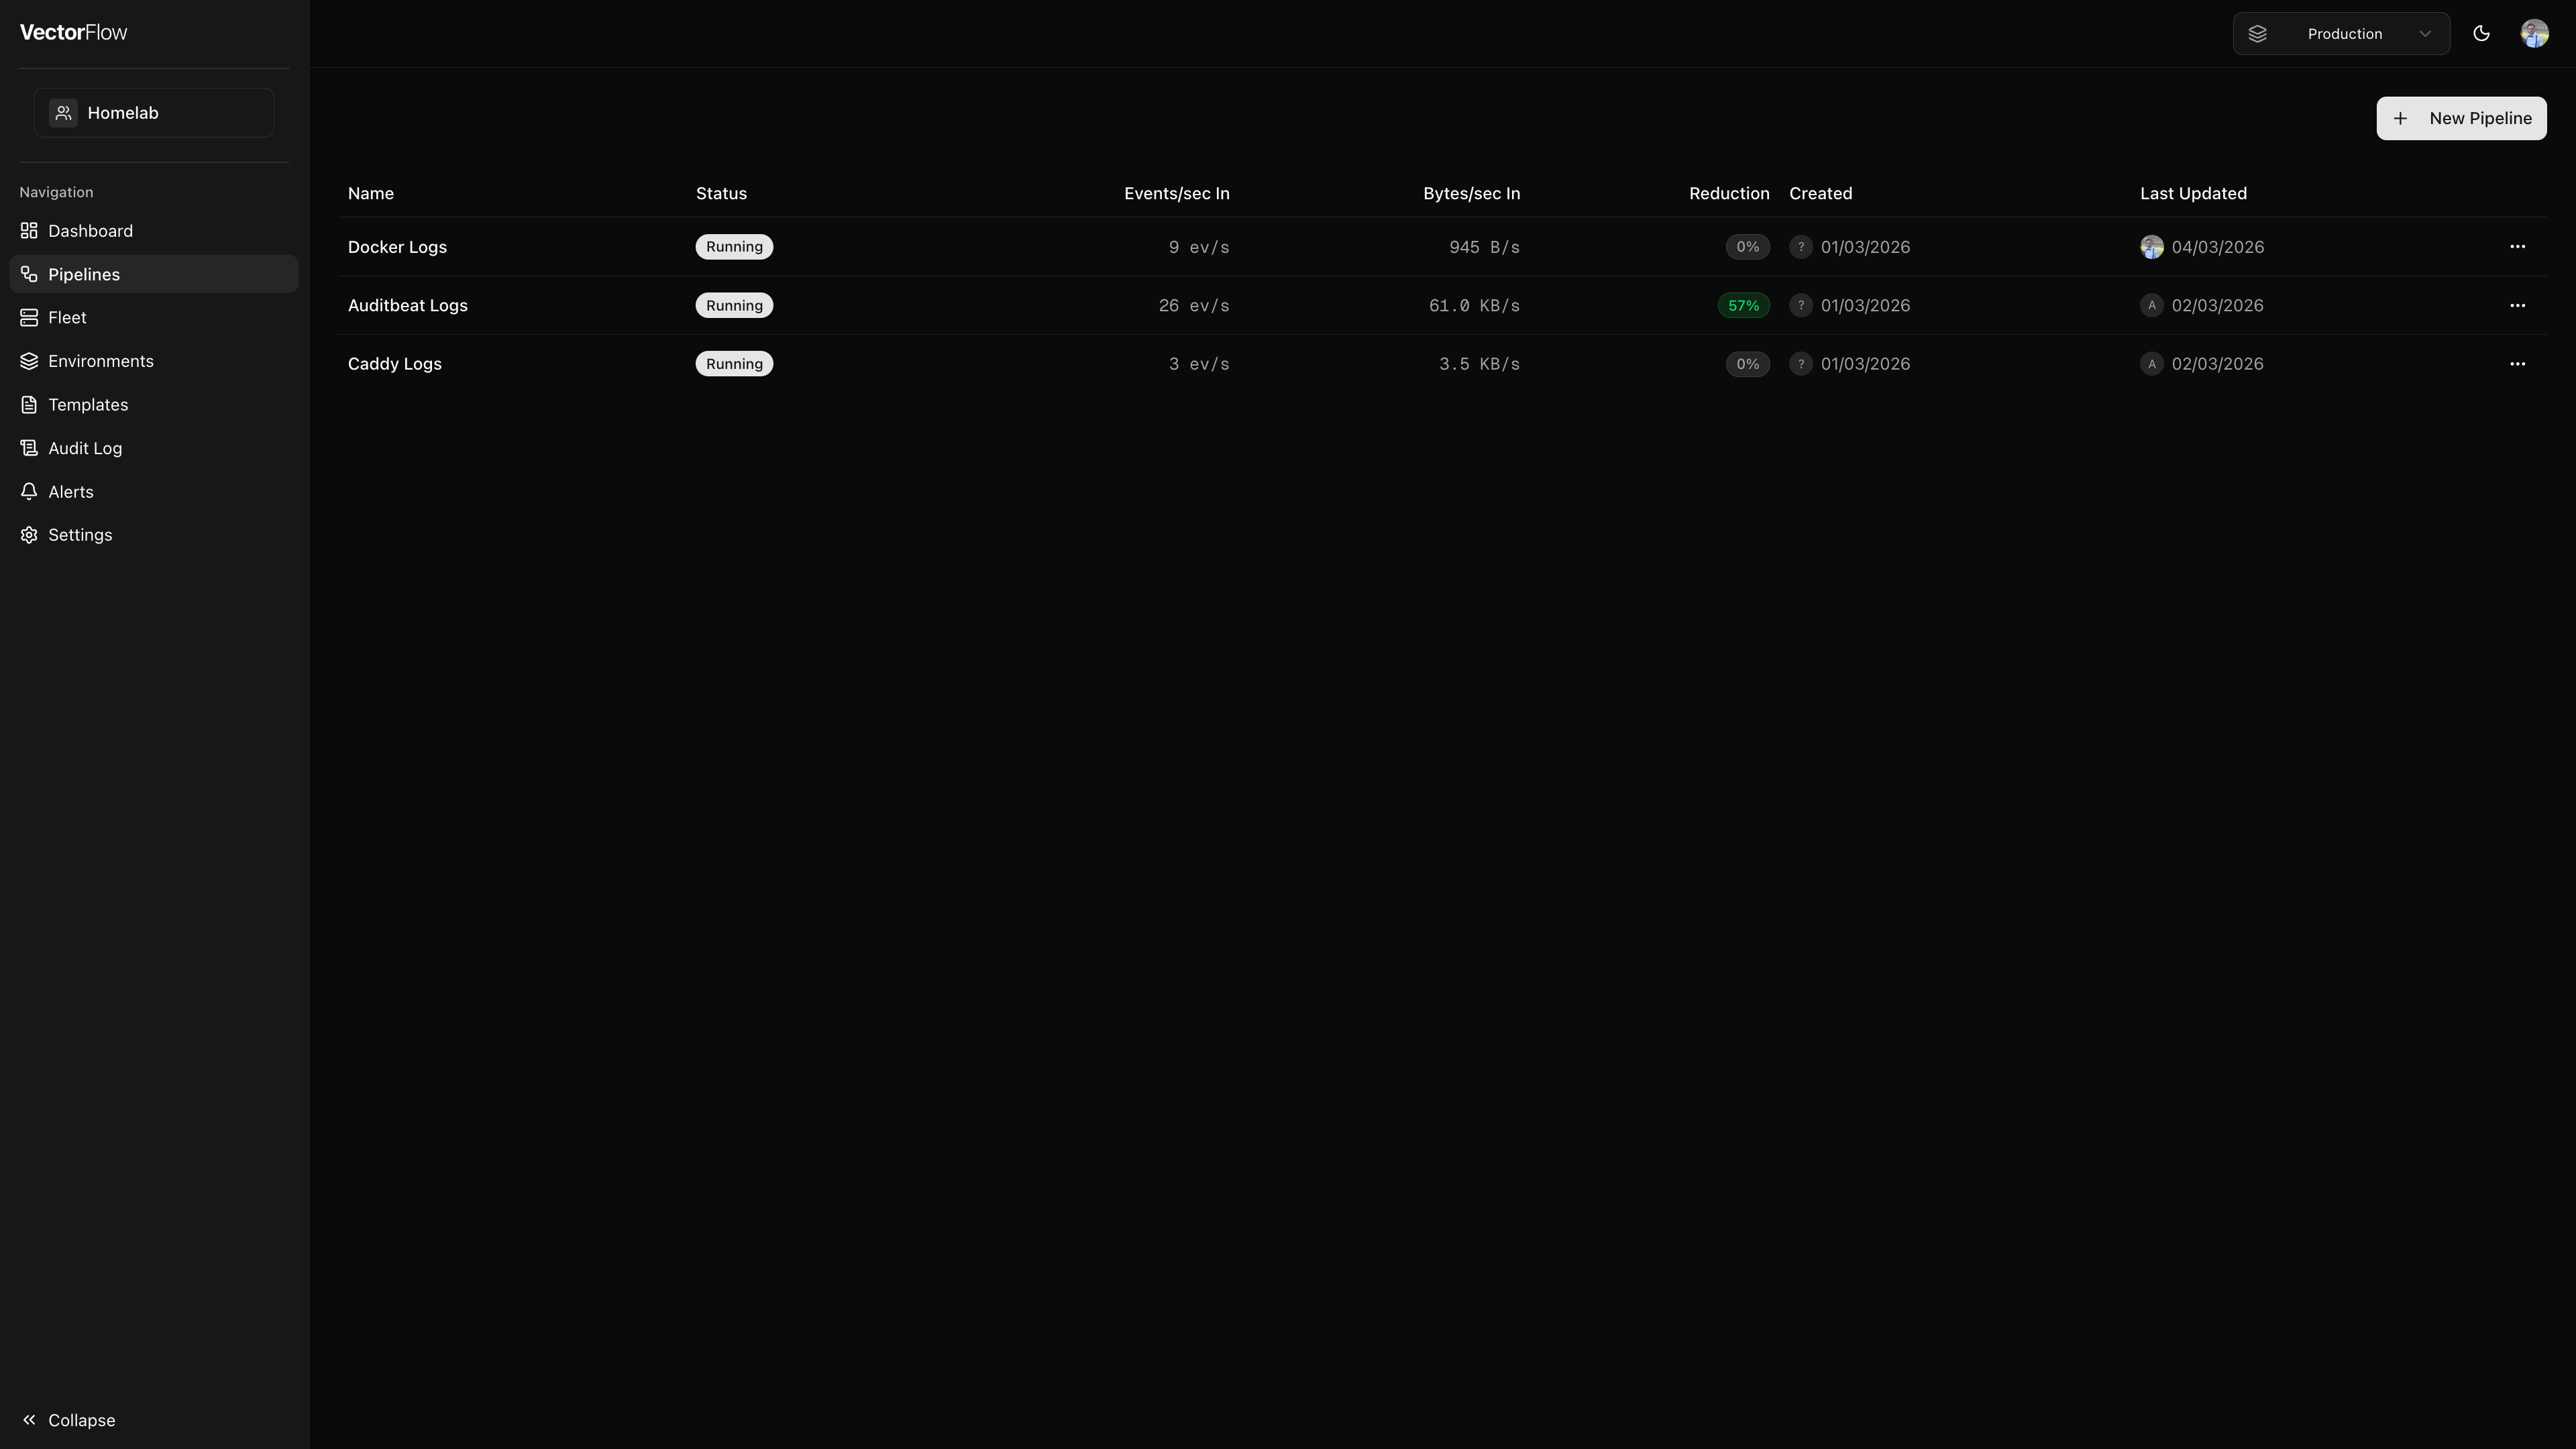
Pipeline list
Pipelines are displayed in a table with the following columns:
| Column | Description |
|---|---|
| Name | The pipeline name. Click it to open the pipeline in the editor. |
| Status | Current lifecycle state (see statuses below). |
| Health | SLI health badge -- green Healthy, yellow Degraded, or gray No SLIs (see Pipeline Health SLIs below). |
| Events/sec In | Live event ingestion rate polled from the agent fleet. |
| Bytes/sec In | Live byte ingestion rate. |
| Reduction | Percentage of events reduced by transforms, color-coded green (>50%), amber (>10%), or neutral. |
| Created | Date and avatar of the user who created the pipeline. |
| Last Updated | Date and avatar of the user who last modified the pipeline. |
Pipeline statuses
A pipeline moves through several states during its lifecycle:
- Draft -- The pipeline has been created but never deployed. It exists only as a saved configuration.
- Running -- The pipeline is deployed and actively processing events on at least one agent node.
- Starting -- The pipeline was recently deployed or restarted and agents are bringing it online.
- Stopped -- The pipeline is deployed but all agent nodes have stopped processing it.
- Crashed -- One or more agent nodes report that the pipeline has crashed. Check the pipeline logs for details.
- Pending deploy -- Shown as an additional badge when the saved configuration differs from what is currently deployed. Deploy the pipeline to push the latest changes.
- Updates available -- Shown as an amber badge when the pipeline contains nodes linked to shared components that have been updated. Hover over the badge to see which shared components have pending updates. Open the pipeline editor to review and accept the changes.
- Pending Approval -- Shown when an editor has submitted a deploy request that is waiting for admin approval. See Deploy approval workflows.
Creating a pipeline
Click New Pipeline
Click the New Pipeline button in the top-right corner. This navigates you to a new, empty pipeline in the editor.
Name your pipeline
Give the pipeline a descriptive name. Names must start with a letter or number and can contain letters, numbers, spaces, hyphens, and underscores (up to 100 characters).
Build and save
Add sources, transforms, and sinks in the pipeline editor. Save your work -- the pipeline starts as a Draft until you deploy it.
Pipeline actions
Each pipeline row has an actions menu (the three-dot icon on the right) with the following options:
- Metrics -- Opens the dedicated metrics page for the pipeline, showing detailed throughput and error charts.
- Clone -- Creates a copy of the pipeline (with " (Copy)" appended to the name) in the same environment and opens it in the editor.
- Promote to... -- Copies the pipeline to a different environment within the same team. This is useful for promoting a pipeline from development to staging or production. Secrets and certificates are stripped during promotion and must be re-configured in the target environment.
- Delete -- Permanently deletes the pipeline and all of its versions.
Deleting a deployed pipeline will automatically undeploy it from all agents before deletion. This means running agents will stop processing the pipeline on their next configuration poll. This action cannot be undone.
Versioning
Every time you deploy a pipeline, a new version is created that captures the full configuration YAML and a changelog entry. Versions let you:
- View history -- See a list of all previously deployed versions with timestamps and the user who deployed them.
- Compare changes -- View diffs between any two versions to understand what changed.
- Rollback -- Restore a previous version if a deployment causes issues.
The pipeline list shows a Pending deploy badge when the saved configuration differs from the most recently deployed version, so you always know if there are undeployed changes.
Pipeline Health SLIs
Service Level Indicators (SLIs) let you define health thresholds for your deployed pipelines. When SLIs are configured, VectorFlow continuously evaluates pipeline metrics against your thresholds and displays the result as a health badge in the pipeline list and pipeline editor toolbar.
Health badges
| Badge | Meaning |
|---|---|
| Healthy (green) | All configured SLIs are within their thresholds. |
| Degraded (yellow) | One or more SLIs have breached their threshold. |
| No SLIs (gray) | No SLI definitions have been configured for this pipeline. |
Draft pipelines do not show a health badge since they are not deployed and have no metrics.
Available metrics
| Metric | Description | Typical condition |
|---|---|---|
| Error Rate | Ratio of errors to total events ingested (errorsTotal / eventsIn). | \< 0.01 (less than 1% errors) |
| Discard Rate | Ratio of discarded events to total events ingested (eventsDiscarded / eventsIn). | \< 0.05 (less than 5% discards) |
| Throughput Floor | Events per second averaged over the evaluation window (eventsIn / windowSeconds). | > 100 (at least 100 events/sec) |
Configuring SLIs
Open pipeline settings
In the pipeline editor, click the Settings gear icon in the toolbar to open the settings popover.
Expand Health SLIs
Click the Health SLIs collapsible section at the bottom of the settings panel.
Add an SLI
Select a Metric (Error Rate, Throughput Floor, or Discard Rate), choose a Condition (less than or greater than), set a Threshold value, and configure the evaluation Window in minutes (1--1440). Click Add SLI to save.
Review and remove
Existing SLIs are listed above the form. Click the trash icon to remove an SLI. Changes take effect immediately -- the pipeline list and toolbar health indicators update on the next evaluation cycle.
Each metric can only have one SLI per pipeline. Adding an SLI for a metric that already has one will update the existing definition.
If no metric data is available for the evaluation window (for example, the pipeline was recently deployed or has no traffic), the SLI is treated as breached and the pipeline health will show as Degraded.
Compliance tags
Compliance tags let you label pipelines with compliance or sensitivity markers such as PII, PHI, PCI-DSS, Internal, or Public. Tags appear as color-coded badges next to pipeline names in the list and help teams quickly identify which data-handling rules apply to each pipeline.
Defining available tags (Admin)
Tags are defined at the team level. Only team admins can manage the list of available tags.
Open team settings
Navigate to Settings and select the Team tab.
Add tags
Scroll to the Compliance Tags card. Type a tag name (up to 30 characters) and click Add. Repeat for each tag you want to make available.
Remove tags
Click the X button on any existing tag to remove it from the available list. Removing a tag from the team does not automatically remove it from pipelines that already have it applied.
Applying tags to pipelines
Open pipeline settings
Open a pipeline in the editor, then click the gear icon in the toolbar to open Pipeline Settings.
Select tags
In the Compliance Tags section, use the dropdown to add tags from the team's available list. Tags are saved immediately.
Remove tags
Click the X on any applied tag badge to remove it from the pipeline.
Tag color coding
Tags are color-coded in the pipeline list for quick visual identification:
| Tag | Color |
|---|---|
| PII | Red |
| PHI | Orange |
| PCI-DSS | Purple |
| Internal | Blue |
| Public | Green |
| Other | Gray |
Tags are metadata labels only -- they do not enforce any access controls or data-handling policies. Use them as a visual aid for compliance awareness and pipeline organization.
Deploy approval workflows
Environments can optionally require deploy approval before a pipeline goes live. When enabled, editors who click Deploy will submit a deploy request instead of deploying directly. Approval and deployment are separate actions -- a reviewer approves the request, and then anyone with deploy access can execute the deployment.
How it works
- An admin enables Require approval for deploys on the environment settings page (see Environments).
- When an editor clicks Deploy in the pipeline editor, the deploy dialog shows a Request Deploy button instead of Publish to Agents.
- The editor submits a deploy request with a changelog entry. The pipeline list and pipeline editor toolbar show a Pending Approval badge.
- Another team member (editor or admin) opens the deploy dialog for the pipeline and sees the request in review mode -- displaying the requester, changelog, and a config diff.
- The reviewer clicks Approve to mark the request as approved. This does not deploy the pipeline.
- Once approved, any team member with deploy access can click Deploy on the approved request to push the configuration to agents.
Request lifecycle
A deploy request moves through these statuses:
| Status | Description |
|---|---|
| Pending | The request is waiting for review. |
| Approved | A reviewer has approved the request. It is ready to be deployed. |
| Deployed | The approved request has been deployed to agents. |
| Rejected | A reviewer has rejected the request (with an optional note). |
| Cancelled | The request was cancelled before deployment. |
Self-approval is blocked. The person who submitted a deploy request cannot approve their own request. This enforces a four-eyes principle -- a second team member must always review the deployment.
Admins can always deploy directly, even when approval is required. When an admin deploys without going through the approval flow, a warning banner is shown to indicate the approval gate was bypassed. The approval gate only applies to users with the Editor role.
Cancelling a request
Anyone with deploy access can cancel a pending or approved deploy request. For pending requests, click the X button next to the Pending Approval badge in the pipeline editor toolbar. For approved requests, click Cancel in the deploy dialog.
Pipeline list indicators
Pipelines with pending or approved deploy requests show a status badge (Pending Approval or Approved) in the status column on the Pipelines page, so team members can quickly identify which pipelines need attention.
Filtering by environment
Pipelines are scoped to the currently selected environment (shown in the sidebar). Switch environments to view pipelines in a different environment. Each environment maintains its own independent set of pipelines, agent nodes, and secrets.