Fleet Management
The Fleet page gives you a centralized view of every agent node enrolled in the current environment. From here you can monitor node health, inspect system resources, view pipeline metrics, trigger agent updates, and stream live logs.
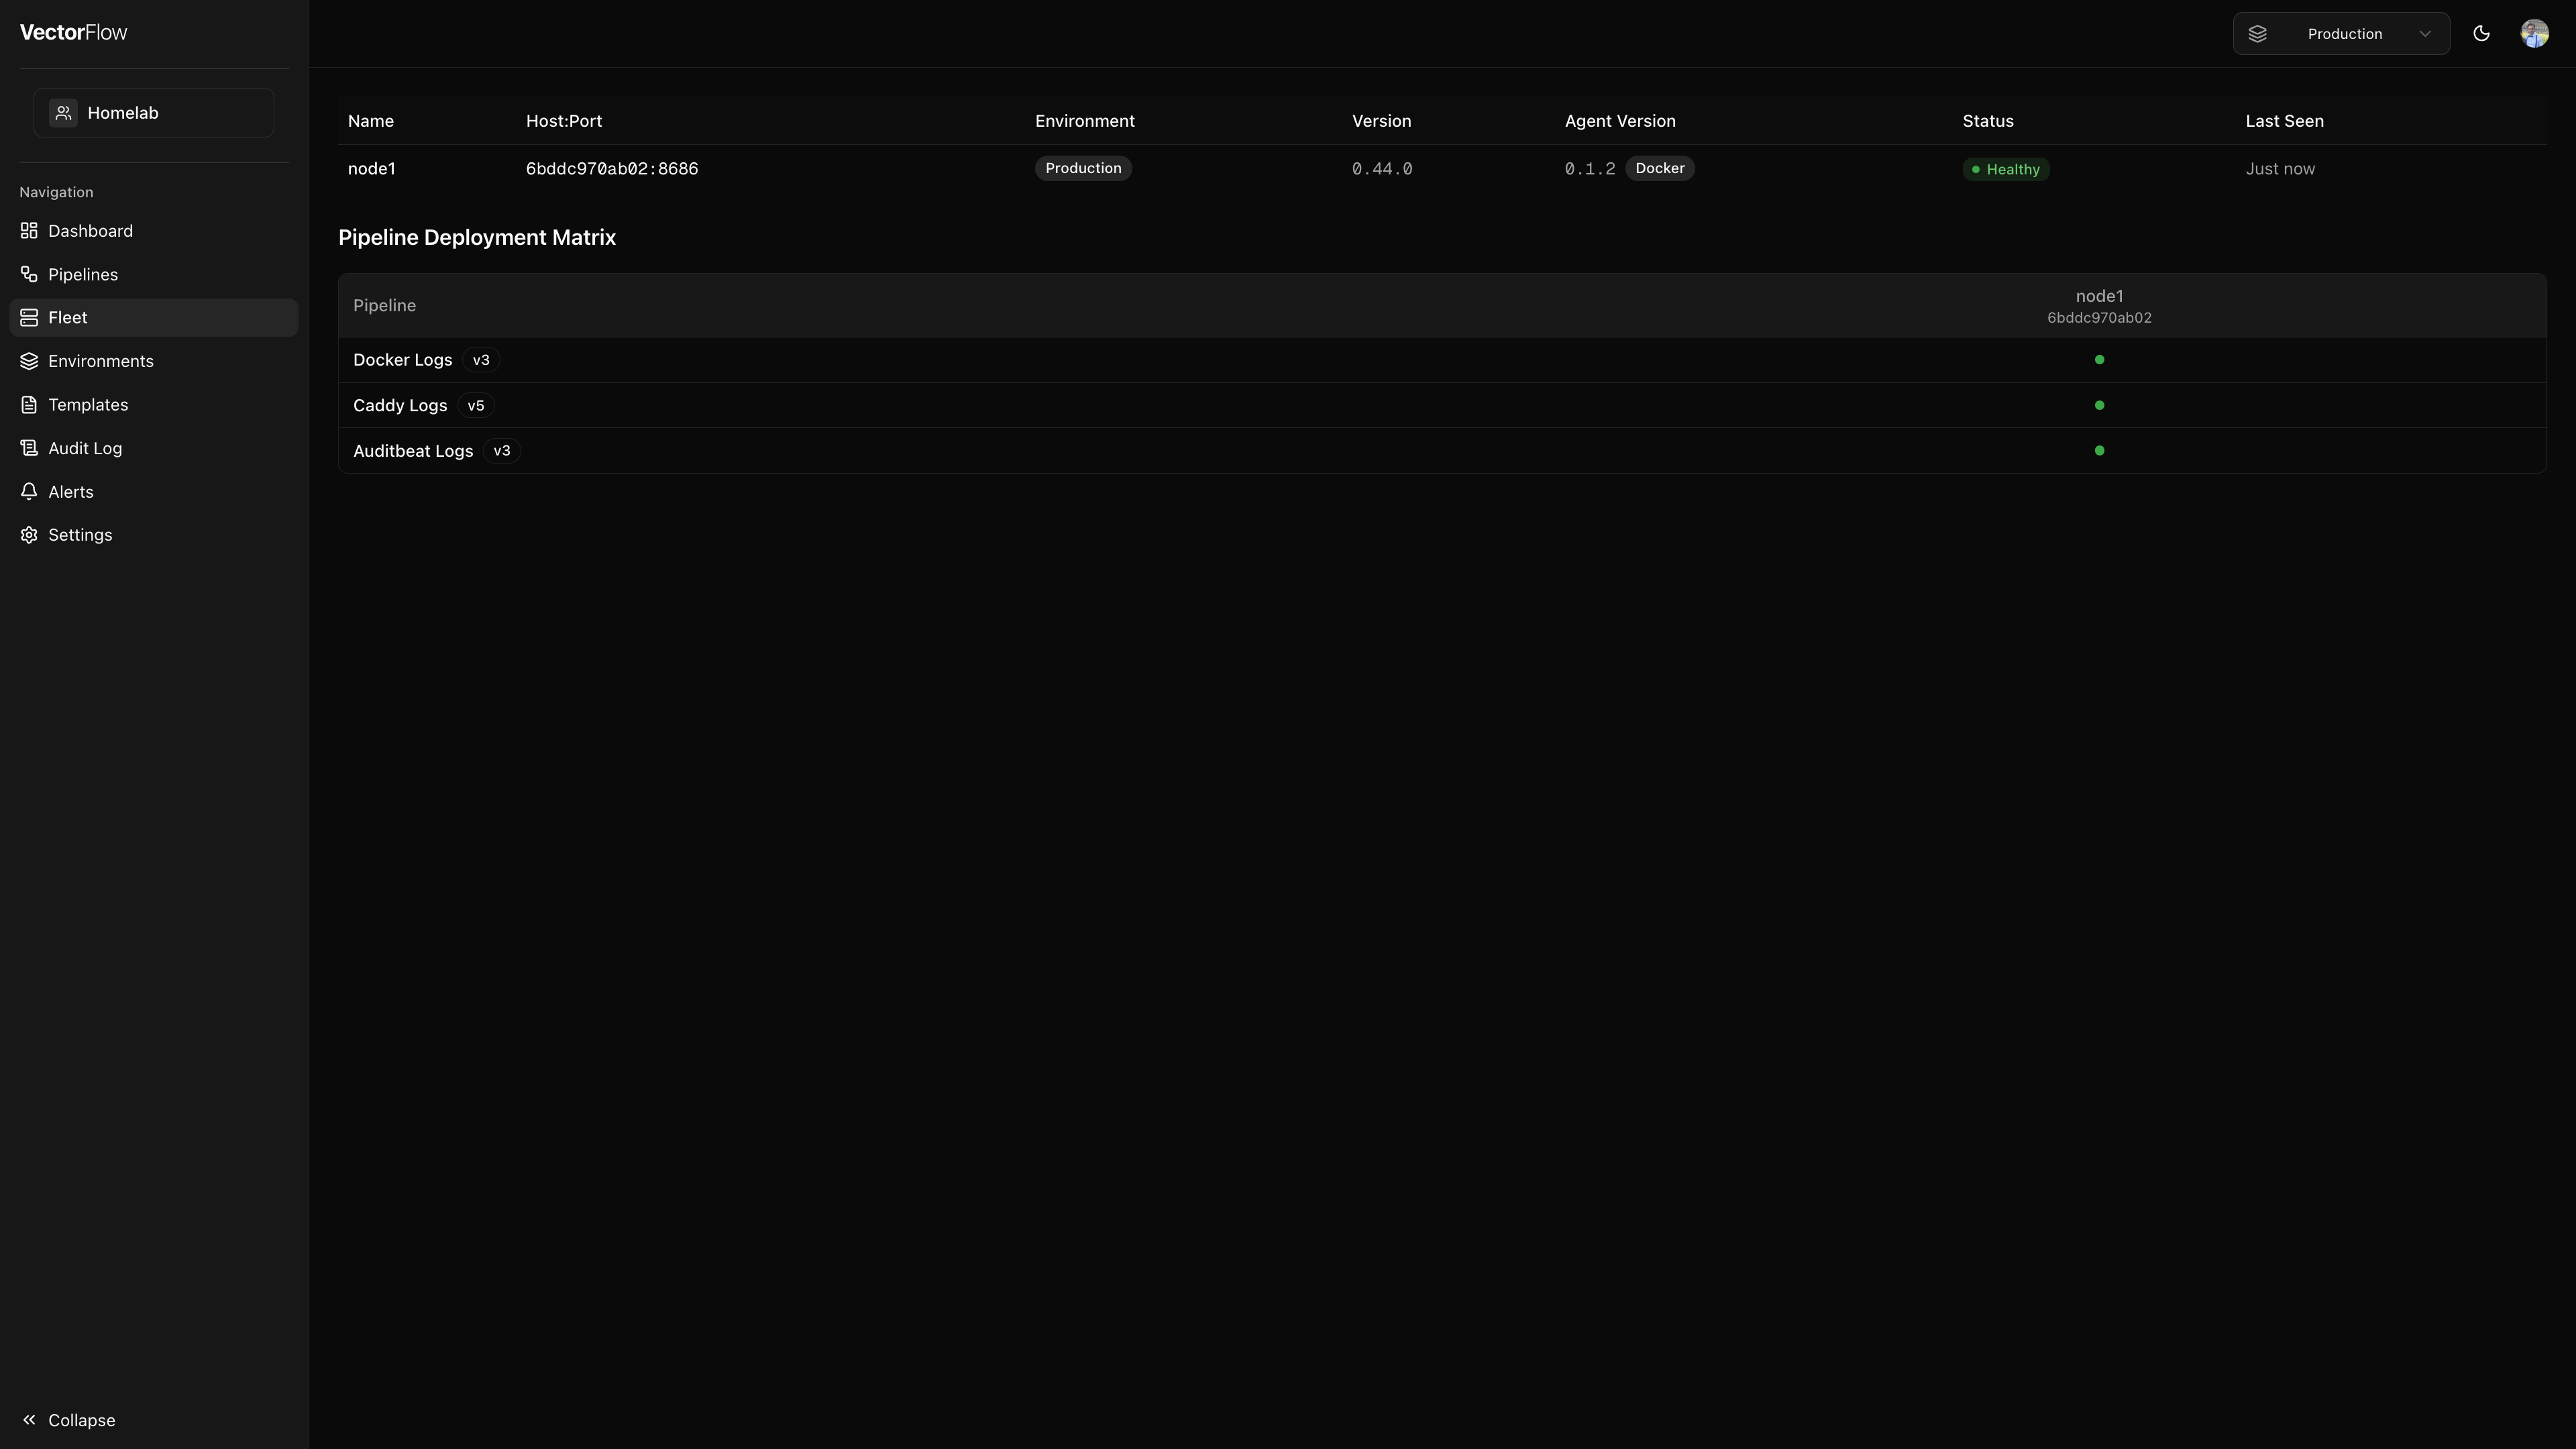
Node list
All enrolled agent nodes are displayed in a table with the following columns:
| Column | Description |
|---|---|
| Name | The node name. Click it to open the node detail page. You can rename nodes from the detail view. |
| Host:Port | The hostname or IP address and API port the agent is listening on. |
| Environment | The environment the node is enrolled in. |
| Labels | Key-value labels assigned to the node, shown as key=value badges. See Node Labels below. |
| Version | The Vector version running on the node. |
| Agent Version | The VectorFlow agent version, plus deployment mode (Docker or Binary). An Update available badge appears when a newer version exists. |
| Status | Current health status (see statuses below). |
| Last Seen | How recently the agent last communicated with the server. |
If no agents have enrolled yet, the page shows a prompt directing you to generate an enrollment token in the environment settings.
Node health statuses
Agent nodes report their health through periodic heartbeats. VectorFlow derives the following statuses:
- Online -- The agent is sending heartbeats within the expected interval. The node is healthy and processing pipelines.
- Unreachable -- The agent has missed heartbeats beyond the configured threshold (default: 3 missed intervals). This typically means the agent process has stopped, the host is down, or there is a network issue.
The heartbeat threshold is calculated as fleetPollIntervalMs * fleetUnhealthyThreshold. With the default settings of a 15-second poll interval and a threshold of 3, a node is marked unreachable after approximately 45 seconds of silence.
You can adjust the heartbeat interval and unhealthy threshold in the system settings.
Node detail page
Click a node name to open its detail page, which provides deep visibility into that specific agent.
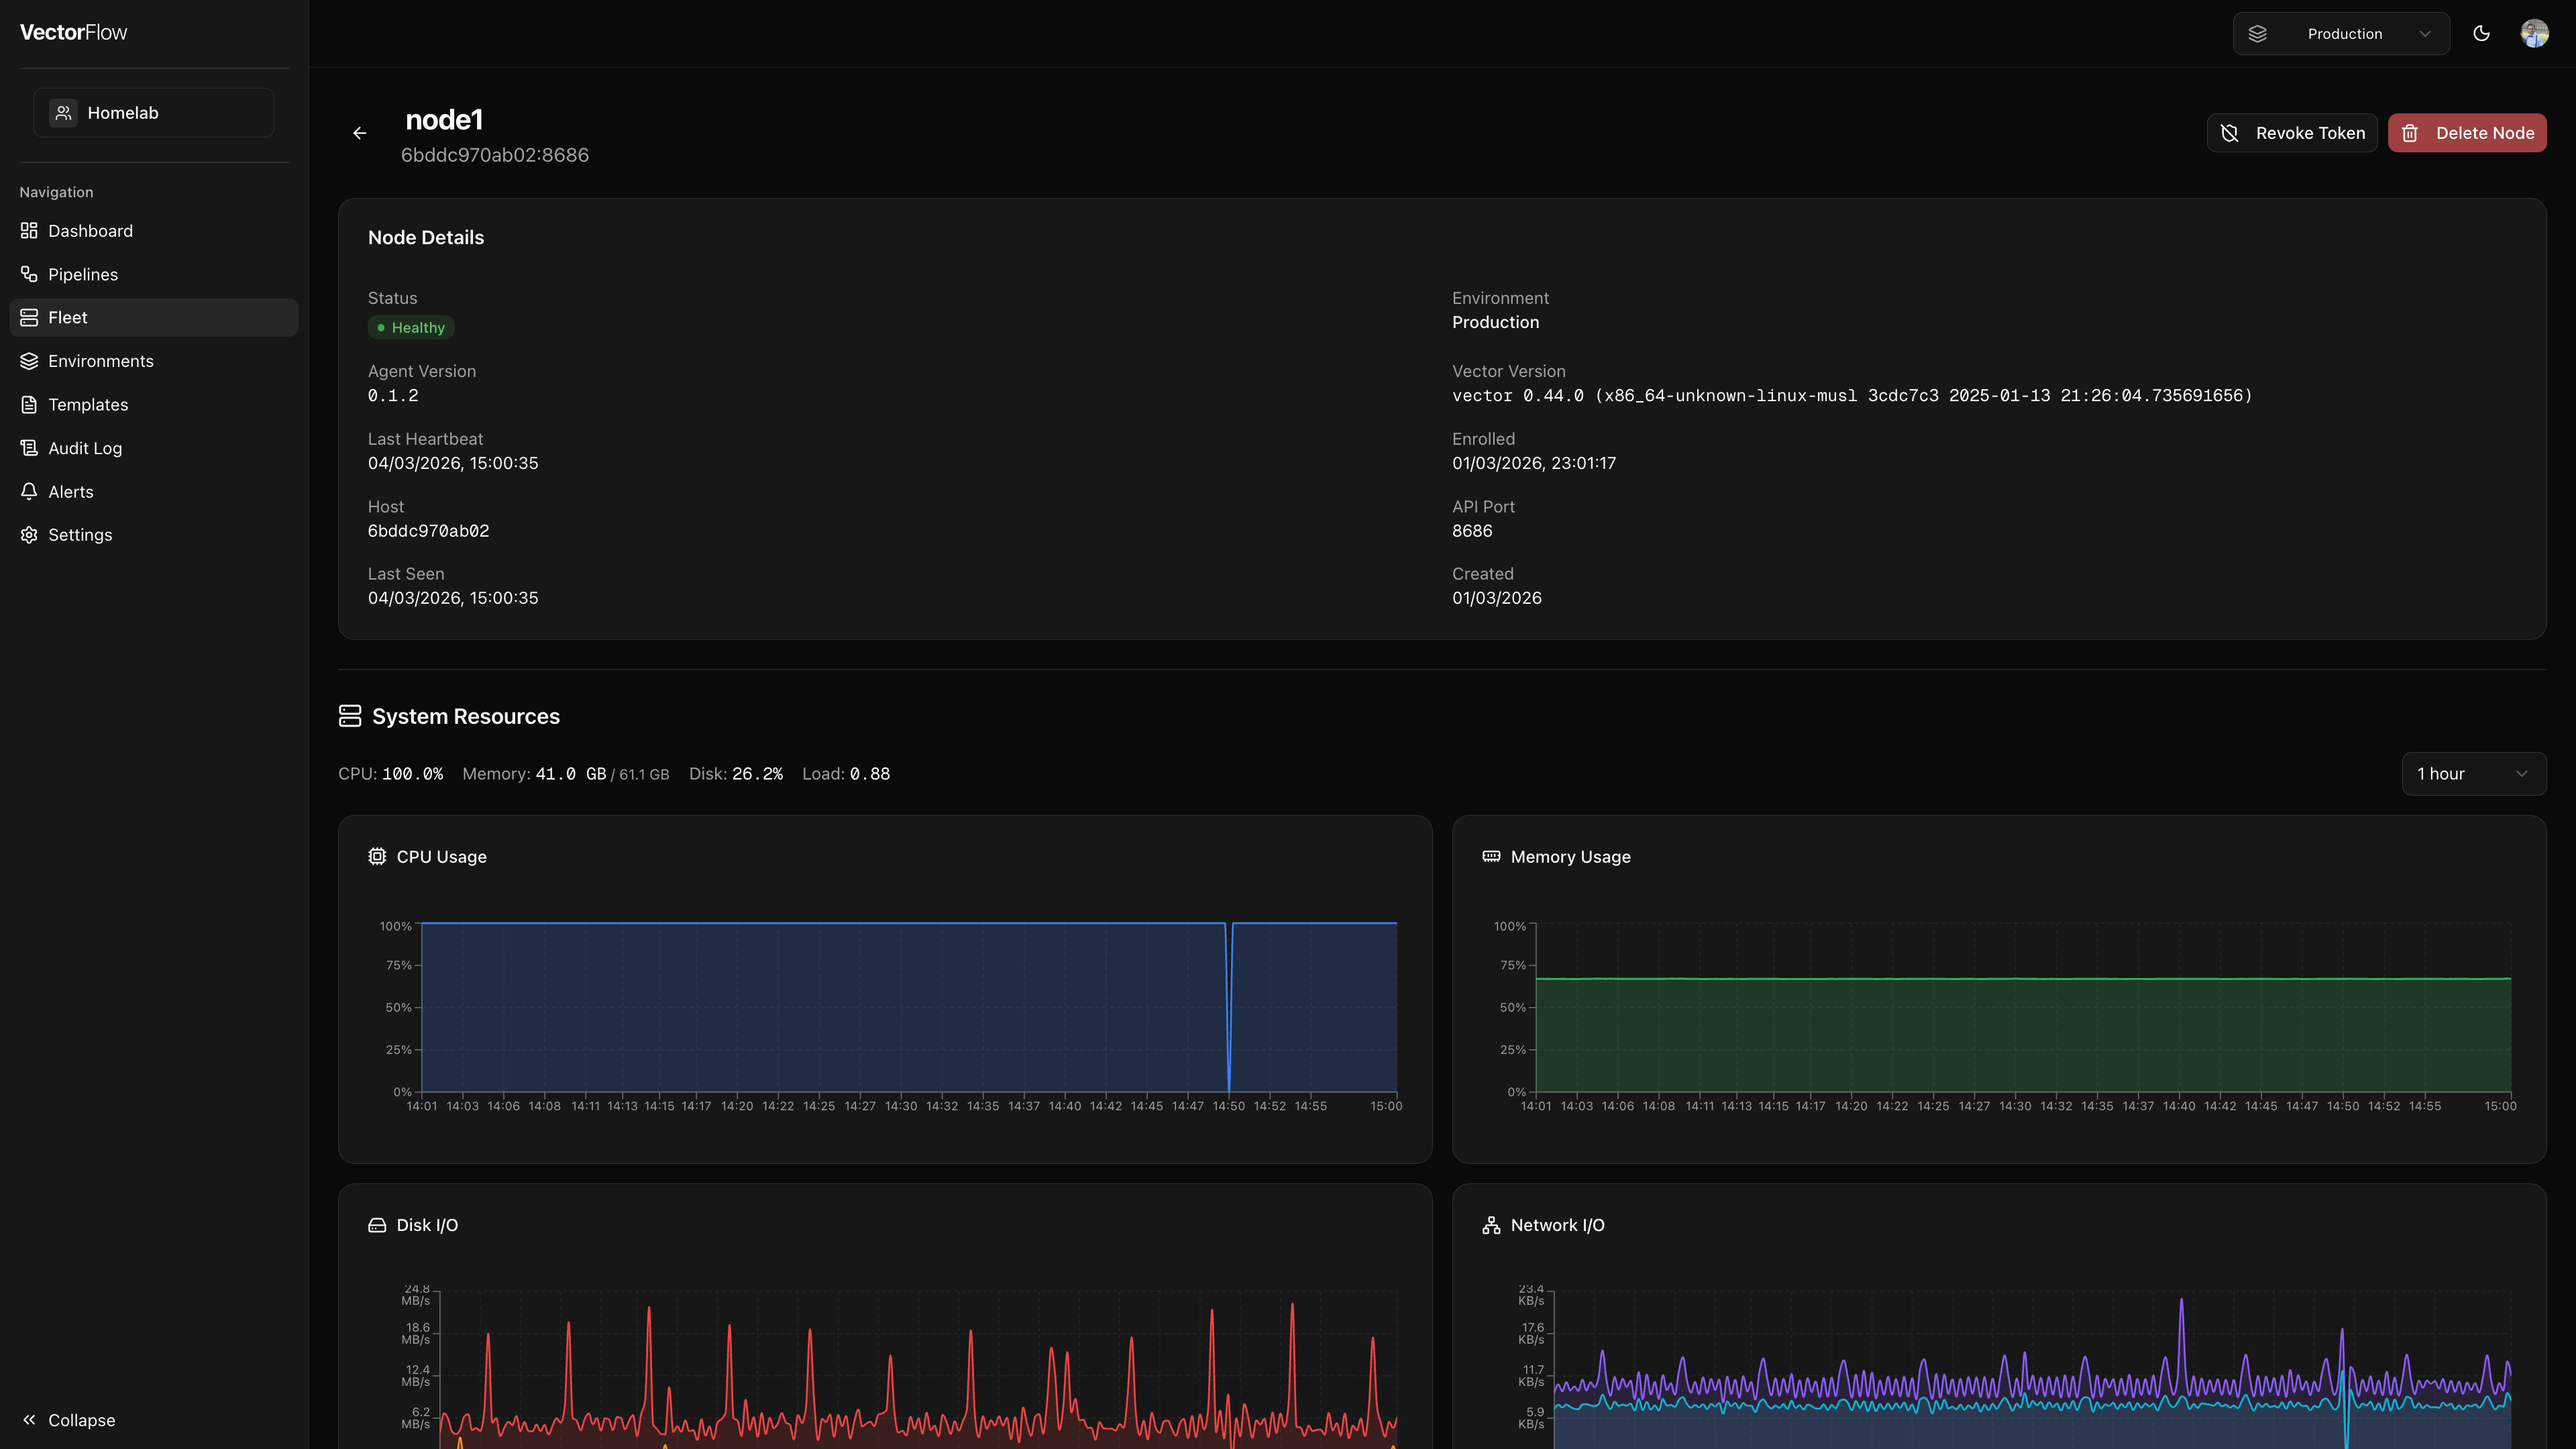
Node details card
A summary card shows key information at a glance:
- Status -- Current health status
- Environment -- Which environment the node belongs to
- Agent Version -- The installed VectorFlow agent version
- Vector Version -- The Vector binary version
- Last Heartbeat -- Timestamp of the most recent heartbeat
- Enrolled -- When the agent first enrolled
- Host / API Port -- Network address details
- Last Seen / Created -- Timestamps for tracking node lifecycle
System resources
Charts display real-time and historical metrics for the node's host machine:
- CPU usage -- Derived from cumulative CPU seconds
- Memory usage -- Used vs. total memory
- Disk usage -- Filesystem used vs. total bytes
- Load averages -- 1, 5, and 15-minute load averages
- Network I/O -- Bytes received and transmitted
- Disk I/O -- Bytes read and written
You can adjust the time window (up to 168 hours / 7 days) to view historical trends.
Pipeline metrics
A table shows every pipeline deployed to the node along with live throughput data:
| Column | Description |
|---|---|
| Pipeline | Pipeline name |
| Status | Running, Stopped, Starting, or Crashed |
| Events In / Out | Total event counts with live per-second rates |
| Errors | Total error count with live error rate (highlighted in red if non-zero) |
| Bytes In / Out | Total bytes processed with live byte rates |
| Uptime | How long the pipeline has been running on this node |
Logs
A live log stream from the agent, with filtering options:
- Log level -- Filter by severity (DEBUG, INFO, WARN, ERROR)
- Pipeline -- Scope logs to a specific pipeline running on the node
Logs are paginated and load on demand.
Agent updates
When a newer agent version is available, an Update available badge appears in the node list. The update mechanism depends on the deployment mode:
Click the Update button in the node list to trigger a self-update. VectorFlow instructs the agent to download the new binary, verify its checksum, and restart. The node shows an Update pending... badge while the update is in progress.
Docker-based agents are updated by pulling the latest image. The Update button is disabled for Docker nodes -- update them by redeploying the container with the new image tag.
Update errors
When a binary agent update fails (for example, due to a download error or checksum mismatch), the fleet page shows an Update failed badge on the affected node. Hover over the badge to see the error details.
Common causes:
| Error | Resolution |
|---|---|
| 404 / download failed | The release asset may not exist. Check that the release tag and binary name are correct on GitHub. |
| checksum mismatch | The downloaded binary does not match the expected hash. This may indicate a corrupted download or a release that was re-published. Retry the update. |
| permission denied | The agent process does not have write access to its own binary. Check file permissions on the agent host. |
The error badge clears automatically after the next successful update.
Pipeline deployment matrix
Below the node list, the Pipeline Deployment Matrix shows a grid of all deployed pipelines across all nodes in the environment. This lets you see at a glance which pipelines are running on which nodes and their current status.
Node labels
Labels are key-value pairs you can attach to nodes for organization and selective deployment. Common uses include tagging nodes by region, role, tier, or any custom dimension relevant to your infrastructure.
Viewing labels
In the fleet table, nodes with labels show a compact "N label(s)" button in the Labels column. Click the button to open a popover displaying all labels as key=value badges. Nodes with no labels show an empty column.
Adding and editing labels
Open the node detail page
Click a node name in the fleet table to open its detail page.
Edit labels
In the Labels card, click the Edit button.
Add or modify labels
Use the key-value input pairs to add, modify, or remove labels. Click Add Label to add a new pair, or click the X button to remove a row.
Save
Click Save Labels to persist the changes.
Editing labels requires the Editor role or above on the team.
Agent-reported labels
Agents can also report labels in their heartbeat payload. When a label is reported by the agent and also set via the UI, the UI value takes precedence. This lets you override agent-reported labels without them being overwritten on the next heartbeat.
Selective deployment with labels
When deploying a pipeline, you can optionally restrict deployment to nodes matching specific labels. In the deploy dialog, the Target Nodes selector lets you pick from all labels in the environment. Selected labels are combined with AND logic -- a node must have all selected labels to receive the pipeline.
The deploy dialog shows a live count of matching nodes (e.g., "3 of 5 nodes match") so you can verify your selection before deploying. When no labels are selected, the pipeline deploys to all nodes in the environment (backward compatible).
Changing a pipeline's node selector on a subsequent deploy updates the targeting. Nodes that no longer match will stop the pipeline on their next poll.
Node groups
Node groups let administrators segment their fleet into logical clusters based on node labels -- for example by datacenter, role, or region. Groups are managed from Settings > Fleet.
Each node group has:
| Field | Description |
|---|---|
| Name | A unique display name for the group within the environment. |
| Criteria | A label selector (key-value pairs) that determines which enrolling nodes match the group. An empty criteria matches all nodes. |
| Label template | Key-value labels that are automatically merged into a node's labels when it enrolls and matches the group's criteria. |
| Required labels | Label keys that every node should have. Nodes missing any required label are flagged as non-compliant in the fleet list. |
Label templates are applied once at enrollment time. Changing a group's template does not retroactively update existing nodes.
Label compliance
When node groups define required labels, the fleet list displays a Non-compliant badge next to any node that is missing one or more of those labels. This is a warn-only indicator -- non-compliant nodes continue to receive heartbeats and deployments normally.
To resolve a non-compliant node, add the missing labels via the node detail page or ensure the node enrolls with matching labels so that group templates apply automatically.
Fleet health dashboard
The Health tab on the Fleet page provides an aggregated view of fleet status organized by node group. This is especially useful for large fleets where you want to see health at a glance before drilling into individual nodes.
Group summary cards
Each node group is represented as a collapsible card showing three metrics:
| Metric | Description |
|---|---|
| Online | Count of HEALTHY nodes out of the group total (e.g. 4/5). Shown in amber when any nodes are offline. |
| Alerts | Count of nodes with at least one firing alert rule. Shown in red when greater than zero. |
| Compliance | Percentage of nodes that have all required labels defined by the group. Shown in amber when below 100%. |
Drill-down
Click any group card to expand it and see a per-node detail table with:
- Name — the node name, linked to its detail page
- Status — current health status badge (Healthy, Degraded, Unreachable, Unknown)
- CPU Load — the 1-minute load average from the latest heartbeat, or
--if no metrics are available - Last Seen — how long ago the node last sent a heartbeat
- Compliance — whether the node has all required labels for the group
Nodes are sorted by health status with the least healthy nodes shown first, then alphabetically by name.
Filtering
The toolbar above the group cards supports three filter types:
- Group — show only a specific group card
- Labels — filter by label key/value pairs (applied to the per-node detail table inside expanded cards)
- Compliance — toggle between All, Compliant (100% compliance rate), or Non-compliant (below 100%)
Filter state is stored in the URL as query parameters, so you can copy and share the URL with filters applied.
Ungrouped nodes
Nodes that do not match the criteria of any defined group appear under an Ungrouped card. This card behaves the same as any other group card — you can expand it to see the per-node table.
The Ungrouped card only appears when at least one node exists outside all group criteria. If all nodes belong to a group, no Ungrouped card is shown.
Maintenance mode
Maintenance mode lets you temporarily stop all pipelines on a node without removing it from the fleet. This is useful for host upgrades, kernel patches, disk maintenance, or any situation where you need the node idle but still connected.
Entering maintenance mode
You can toggle maintenance mode from two places:
- Fleet list -- Click the Maintenance button in the node's row.
- Node detail page -- Click the Enter Maintenance button in the header, or the Exit Maintenance button in the orange banner.
Both locations show a confirmation dialog before entering maintenance mode. The dialog warns that all running pipelines on the node will be stopped.
What happens in maintenance mode
When maintenance mode is enabled on a node:
- The node's status badge changes to an orange Maintenance indicator with a wrench icon.
- On the next poll, the agent receives an empty pipeline list from the server, causing all running pipelines to stop gracefully.
- The agent continues sending heartbeats, so the node remains visible and manageable in the fleet UI.
Maintenance mode is per-node. Other nodes in the same environment continue running their pipelines normally.
Exiting maintenance mode
Click Exit Maintenance from the fleet list or the node detail page. No confirmation is required. On the next poll cycle, the agent receives its full pipeline configuration again and automatically restarts all pipelines.
Toggling maintenance mode requires the Admin role on the team.
Drift Detection
Drift detection monitors your fleet for discrepancies between the expected state (what the server says should be running) and the actual state (what agents report). VectorFlow tracks two types of drift:
Version drift
Version drift occurs when one or more nodes are running a different pipeline version than the latest deployed version. For example, if Pipeline A is at version 5 on the server but a node is still running version 4, that pipeline has version drift on that node.
Version drift is evaluated fleet-wide across all deployed pipelines in an environment. The system compares each node's reported pipeline version (from its heartbeat) against the latest deployed version in the database.
Config drift
Config drift occurs when a node's running configuration checksum does not match the expected checksum computed by the server. This can happen when:
- A deploy was initiated but the agent has not yet picked up the new configuration
- The agent's local config file was modified outside of VectorFlow
- A network issue prevented the agent from receiving the latest config
Config drift is evaluated per-node during heartbeat processing by comparing the agent-reported configChecksum against the server-side expected checksum.
Older agents that do not report a config checksum are excluded from config drift detection -- they do not count as drifted.
Drift alerts
Drift metrics feed into the fleet alerting system. When version drift is detected, alerts can be triggered based on your configured alert rules. The alert message includes details about which pipelines are drifted and what versions each node is running.
Responding to drift
When drift is detected:
- Version drift -- Check if the affected nodes are reachable and polling. Most version drift resolves automatically on the next agent poll cycle. If it persists, verify the agent is running and can reach the server.
- Config drift -- Verify that the agent is receiving the latest configuration. Re-deploying the pipeline can force a fresh config push. If the agent's local config was manually modified, the next poll cycle will overwrite it with the server's version.
Node management
From the node detail page you can:
- Rename -- Click the node name in the header to edit it inline.
- Revoke Token -- Revokes the node's authentication token, preventing it from communicating with the server. The node is marked as unreachable.
- Delete Node -- Permanently removes the node record from VectorFlow. This does not stop the agent process on the remote host.
Revoking a node token immediately prevents the agent from sending heartbeats or receiving pipeline updates. The agent process continues running on the host but operates in isolation until re-enrolled.