Pipeline Editor
The pipeline editor is a visual canvas where you design data pipelines by connecting sources, transforms, and sinks. It provides a drag-and-drop interface powered by a flow-graph layout, so you can build and modify pipelines without writing configuration files by hand.
Editor layout
The editor is divided into four main areas:
| Area | Location | Purpose |
|---|---|---|
| Component Palette | Left sidebar | Lists all available Vector component types, organized by kind and category. |
| Canvas | Center | The main workspace where you arrange and connect nodes. |
| Detail Panel | Right sidebar | Configuration form for the currently selected node. |
| Toolbar | Top bar | Actions for saving, validating, deploying, and managing the pipeline. |
Component palette
The left sidebar has two tabs:
- Catalog -- Lists every available Vector component, grouped by kind (Sources, Transforms, Sinks). Each section can be collapsed and is further organized by category (e.g. "Cloud Platform", "Aggregating", "Messaging").
- Shared -- Lists shared components available in the current environment. Filter by kind using the All / Source / Transform / Sink buttons.
Use the search bar at the top of the palette to filter components by name, type, description, or category. The search applies to whichever tab is active.
Adding a component
Drag a component from the palette and drop it onto the canvas. A new node appears at the drop position, pre-configured with sensible defaults. You can also right-click the canvas to paste previously copied nodes.
Dragging a shared component from the Shared tab creates a linked node -- the node's configuration is pre-filled from the shared component and pinned to its current version. See Shared Components for details on linked node behavior.
Canvas
The canvas is where your pipeline takes visual shape. Each component is represented as a node, and data flow between components is represented as edges (connections).
Interacting with the canvas
- Pan -- Click and drag on empty canvas space to move around.
- Zoom -- Use the scroll wheel or the zoom controls in the bottom-left corner.
- Select a node -- Click a node to select it. Its configuration appears in the detail panel on the right.
- Multi-select -- Hold Shift and click additional nodes to select multiple components at once. The detail panel shows bulk actions (Copy All, Delete All).
- Reposition -- Drag a node to move it to a new position on the canvas.
- Connect nodes -- Drag from a node's output port (right side) to another node's input port (left side) to create a connection. The editor enforces data-type compatibility and prevents self-connections.
- Fit to view -- The canvas automatically fits all nodes into view when first loaded. Use the zoom controls to reset the view.
Context menus
- Right-click a node -- Opens a menu with Copy, Paste, Duplicate, Delete, and Save as Shared Component actions. The shared component option extracts the node's configuration into a reusable shared component and links the node to it.
- Right-click an edge -- Opens a menu with a Delete connection action.
Node types
Sources
Sources are where data enters the pipeline. They have an output port on the right side and are color-coded green. Examples include:
syslog-- Receive syslog messages over TCP or UDPfile-- Tail log files from diskkafka-- Consume from Kafka topicshttp_server-- Accept events over HTTPdemo_logs-- Generate synthetic log events for testingdatadog_agent,splunk_hec-- Receive data from vendor agents
Transforms
Transforms process and modify data as it flows through the pipeline. They have both an input port (left) and an output port (right), and are color-coded blue. Key types include:
remap-- Apply VRL (Vector Remap Language) expressions to reshape eventsfilter-- Drop events that do not match a VRL conditionsample-- Randomly sample a percentage of eventsroute-- Split events into multiple outputs based on VRL conditionsdedupe-- Remove duplicate events based on field valuesreduce-- Aggregate multiple events into onelog_to_metric-- Convert log events into metric data
Sinks
Sinks are where data exits the pipeline to downstream destinations. They have an input port on the left side and are color-coded orange. Examples include:
elasticsearch-- Send to Elasticsearch / OpenSearchaws_s3-- Write to Amazon S3 bucketshttp-- Forward over HTTP to any endpointconsole-- Print to standard output (useful for debugging)datadog_logs,splunk_hec_logs-- Send to vendor platformskafka-- Produce to Kafka topicsloki-- Send to Grafana Loki
Live metrics on nodes
When a pipeline is deployed, each node displays live throughput metrics directly on the canvas:
- Events per second and bytes per second in a compact readout
- A status dot indicating health (green for healthy, amber for degraded)
- A sparkline showing recent throughput trends
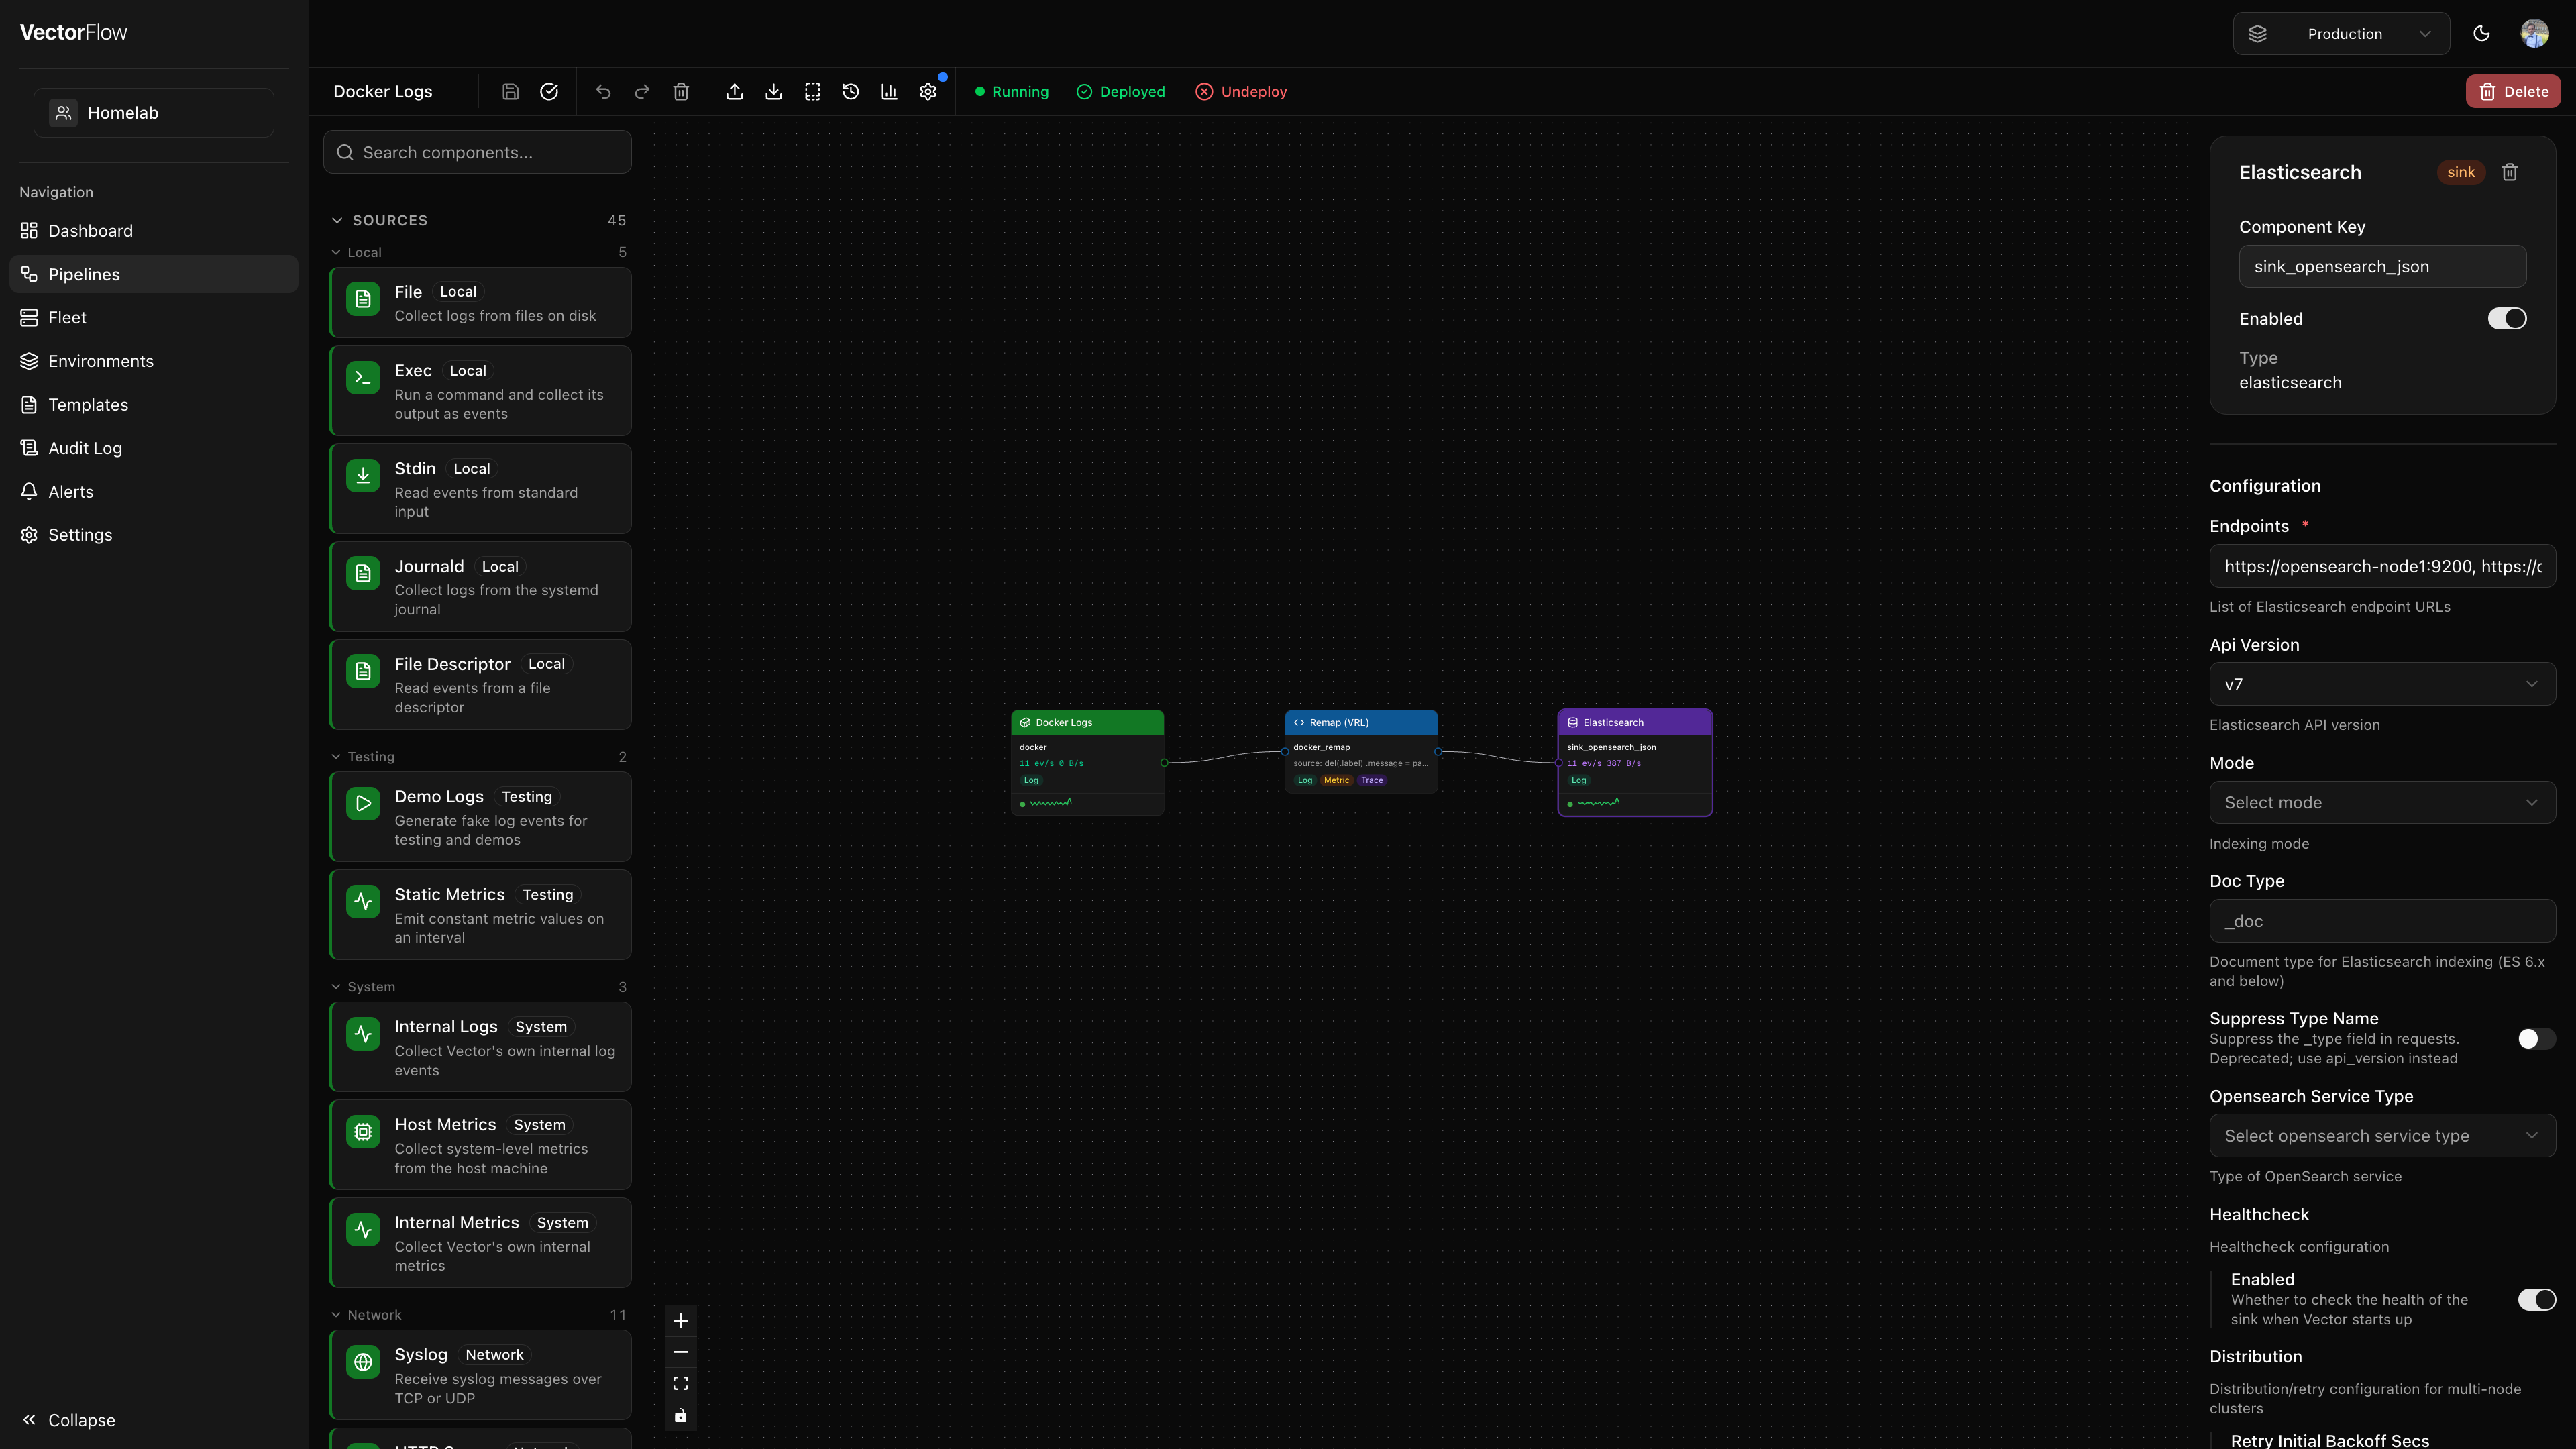
Detail panel
Click any node on the canvas to open its configuration in the detail panel on the right.
The panel has two tabs:
- Config -- The component configuration form (always visible).
- Live Tail -- Sample live events flowing through the component (visible only when the pipeline is deployed). See Live Tail below.
The Config tab shows:
- Component name and kind -- The display name, a badge indicating source/transform/sink, and a delete button.
- Name -- A human-readable label for the component (e.g. "Traefik Logs"). Changing the name requires saving, but does not require a redeploy.
- Component ID -- An auto-generated unique identifier used in the backend configuration (read-only). This key is set when the node is created and never changes.
- Enabled toggle -- Disable a component to exclude it from the generated configuration without removing it from the canvas.
- Type -- The Vector component type (read-only).
- Configuration form -- Auto-generated form fields based on the component's configuration schema. Required fields are marked, and each field has contextual help.
- Secret picker -- Sensitive fields (passwords, API keys, tokens) display a secret picker instead of a text input. You must select an existing secret or create a new one inline -- plaintext values cannot be entered directly into sensitive fields. See Security for details.
Linked shared components
When a node is linked to a shared component, the detail panel shows additional elements:
- A purple banner with the shared component name and an "Open in Library" link.
- Read-only configuration -- All config fields are disabled. Edits must be made on the shared component's Library page.
- An Unlink button to convert the node back to a regular editable component (the current config snapshot is preserved).
- When the shared component has been updated since the node was last synced, an amber update banner appears with an "Accept update" button to pull in the latest configuration.
VRL editor for transforms
For remap, filter, and route transforms, the detail panel includes an integrated VRL editor (powered by Monaco) instead of a plain text field. The VRL editor provides:
- Syntax highlighting for VRL code
- Autocomplete for VRL functions
- An inline snippet drawer to insert common VRL patterns (see VRL Snippets)
- A fields panel showing the schema of upstream source events
- A test runner that lets you execute your VRL code against sample JSON events and see the output
Toolbar
The toolbar runs along the top of the editor and provides the following actions (left to right):
| Action | Shortcut | Description |
|---|---|---|
| Save | Cmd+S | Save the current pipeline state. A dot indicator appears when there are unsaved changes. |
| Validate | -- | Run server-side validation on the generated Vector configuration and report any errors. |
| Undo | Cmd+Z | Undo the last change. |
| Redo | Cmd+Shift+Z | Redo a previously undone change. |
| Delete | Delete | Delete the currently selected node or edge. |
| Import | Cmd+I | Import a Vector configuration file (YAML or TOML) to populate the canvas. |
| Export | Cmd+E | Export the pipeline as a YAML or TOML file. |
| Save as Template | -- | Save the current pipeline layout as a reusable template. |
| Version History | -- | View all deployed versions, compare diffs, and rollback to a previous version. |
| Discard Changes | -- | Revert the pipeline to its last deployed configuration. Only visible when the pipeline is deployed and has unsaved changes. |
| Metrics | -- | Toggle the metrics chart panel at the bottom of the editor. |
| Logs | -- | Toggle the live logs panel. A red dot appears when recent errors have been detected. |
| Settings | -- | Open pipeline-level settings (log level, global configuration). A blue dot indicates active global config. |
Pipeline settings
Click the Settings button in the toolbar to open the pipeline settings panel. Available options include:
- Log Level -- Sets the Vector log verbosity for this pipeline (
trace,debug,info,warn,error). - Metadata Enrichment -- When enabled, VectorFlow automatically injects a
vectorflow_metadata_enrichremap transform before every sink at deploy time. This adds two fields to every event:.vectorflow.environment-- the name of the environment the pipeline is deployed in..vectorflow.pipeline_version-- the version number of this deployment.
- Compliance Tags -- Assign compliance labels (e.g. PII, PCI-DSS) to the pipeline.
- Global Configuration (JSON) -- Advanced Vector configuration such as enrichment tables.
- Health SLIs -- Define service-level indicators to monitor pipeline health.
The metadata enrichment transform is invisible in the editor canvas. It is only injected into the generated Vector config at deploy time, so you will see it in the deploy preview diff but not as a node on the canvas.
Deploy and undeploy
The right side of the toolbar shows the current deployment state:
- Deploy button -- Appears when the pipeline has never been deployed, or when changes have been made since the last deployment. Clicking Deploy first auto-saves, then opens the deploy dialog.
- Deployed indicator -- A green checkmark shown when the deployed configuration matches the saved state.
- Undeploy button -- Stops the pipeline on all agents and reverts it to draft status. You can redeploy at any time.
- Process status -- A colored dot and label showing the runtime status: Running (green), Starting (yellow), Stopped (gray), or Crashed (red).
Pipeline logs panel
Toggle the logs panel from the toolbar to view real-time logs from the running pipeline. The panel supports:
- Level filtering -- Toggle visibility of ERROR, WARN, INFO, DEBUG, and TRACE log levels using the badges in the toolbar.
- Search -- Type in the search box to filter loaded log lines by keyword. Matching text is highlighted in yellow. The line counter updates to show how many lines match (e.g., "42/318 lines").
- Node filtering -- When viewing logs for a pipeline running on multiple nodes, filter by specific agent node.
- Pagination -- Scroll to the top to automatically load older log entries, or click Load older to fetch the next page.
Search filters the logs that are already loaded in the browser. It does not query the server — to find older log entries, load more pages first, then search.
The logs panel only shows data for deployed pipelines. Draft pipelines have no running processes to produce logs.
Live Tail
Live Tail lets you sample real events flowing through any component in a deployed pipeline, directly from the detail panel. This is useful for verifying that data is being ingested, transformed, and routed as expected.
How to use Live Tail
Deploy the pipeline
Live Tail requires a running pipeline. If the pipeline is still a draft, deploy it first using the Deploy button in the toolbar.
Select a component
Click any node on the canvas to open the detail panel.
Switch to the Live Tail tab
In the detail panel, click the Live Tail tab. This tab only appears for deployed pipelines.
Sample events
Click Sample 10 Events to request a batch of live events from the selected component. The panel polls for results and displays them as they arrive.
Each sampled event appears as a collapsed row showing a JSON preview. Click any row to expand it and view the full event payload with formatted JSON.
- Events are shown newest-first, and the panel retains up to 50 events across multiple sampling requests.
- Each sampling request has a two-minute expiry. If no events are captured within that window, the request expires silently.
- You can sample from any component type -- sources, transforms, or sinks.
Live Tail uses the agent's event sampling infrastructure. The agent captures a snapshot of events passing through the selected component and returns them on its next heartbeat. There is no persistent stream -- each click of "Sample 10 Events" triggers a new one-shot capture.
Pipeline rename
Click the pipeline name in the top-left corner of the editor to rename it inline. Press Enter to confirm or Escape to cancel.
Keyboard shortcuts
| Shortcut | Action |
|---|---|
Cmd+S | Save pipeline |
Cmd+Z | Undo |
Cmd+Shift+Z | Redo |
Cmd+C | Copy selected node(s) |
Cmd+V | Paste copied node(s) |
Cmd+D | Duplicate selected node |
Cmd+E | Export configuration |
Cmd+I | Import configuration |
Delete / Backspace | Delete selected node or edge |
On Windows and Linux, use Ctrl instead of Cmd for all keyboard shortcuts.
Cross-Environment Promotion
Promote a pipeline from one environment to another (e.g., dev to staging, staging to production) with built-in validation and approval workflow.
Promoting a Pipeline
- From the pipeline list, click the ... menu on any pipeline and select Promote to...
- Select the target environment and optionally rename the pipeline
- VectorFlow validates that all secret references in the pipeline exist in the target environment
- Review the substitution diff showing what will change between environments
- Click Confirm Promotion to submit
Approval Workflow
If the target environment has Require Deploy Approval enabled, the promotion creates a request that must be approved by an administrator before the pipeline appears in the target environment.
If approval is not required, the pipeline is promoted immediately.
Secret Pre-flight Validation
Before promotion proceeds, VectorFlow checks that every SECRET[name] reference in the source pipeline has a corresponding secret defined in the target environment. If any secrets are missing, promotion is blocked with a clear list of which secrets need to be created.
Promotion History
Each pipeline's detail page shows a promotion history log with source environment, target environment, who promoted, and the current status.
AI-Powered Suggestions
When AI is configured for your team (Settings → AI), two AI features become available:
VRL Assistant
In the VRL editor, click the AI button in the tools panel. Type a natural language description of what you want the VRL code to do, and the AI will generate VRL code. You can Insert (append) or Replace the current code.
Pipeline Builder
In the pipeline editor toolbar, click the sparkle icon to open the AI Pipeline Builder. Two modes are available:
- Generate: Describe a pipeline in plain language (e.g., "Collect K8s logs, drop debug, send to Datadog"). The AI generates Vector YAML config that is applied directly to your canvas.
- Review: Ask the AI to review your current pipeline configuration for performance, correctness, and best practices.
Configuration
Team admins can configure AI in Settings → AI. VectorFlow supports any OpenAI-compatible API (OpenAI, Anthropic, Ollama, Groq, Together, etc.).