Your First Pipeline
This walkthrough guides you through creating a simple pipeline that generates demo log events, transforms them with VRL (Vector Remap Language), and outputs the result to the console. By the end, you will have a working pipeline deployed to your fleet.
Prerequisites
- A running VectorFlow server (Quick Start)
- At least one enrolled agent (Deploy Agents)
Build the pipeline
Create a new pipeline
Navigate to Pipelines in the sidebar and click New Pipeline.
Name and configure
Give the pipeline a name (e.g., demo-pipeline) and select the environment where your agent is enrolled. Click Create.
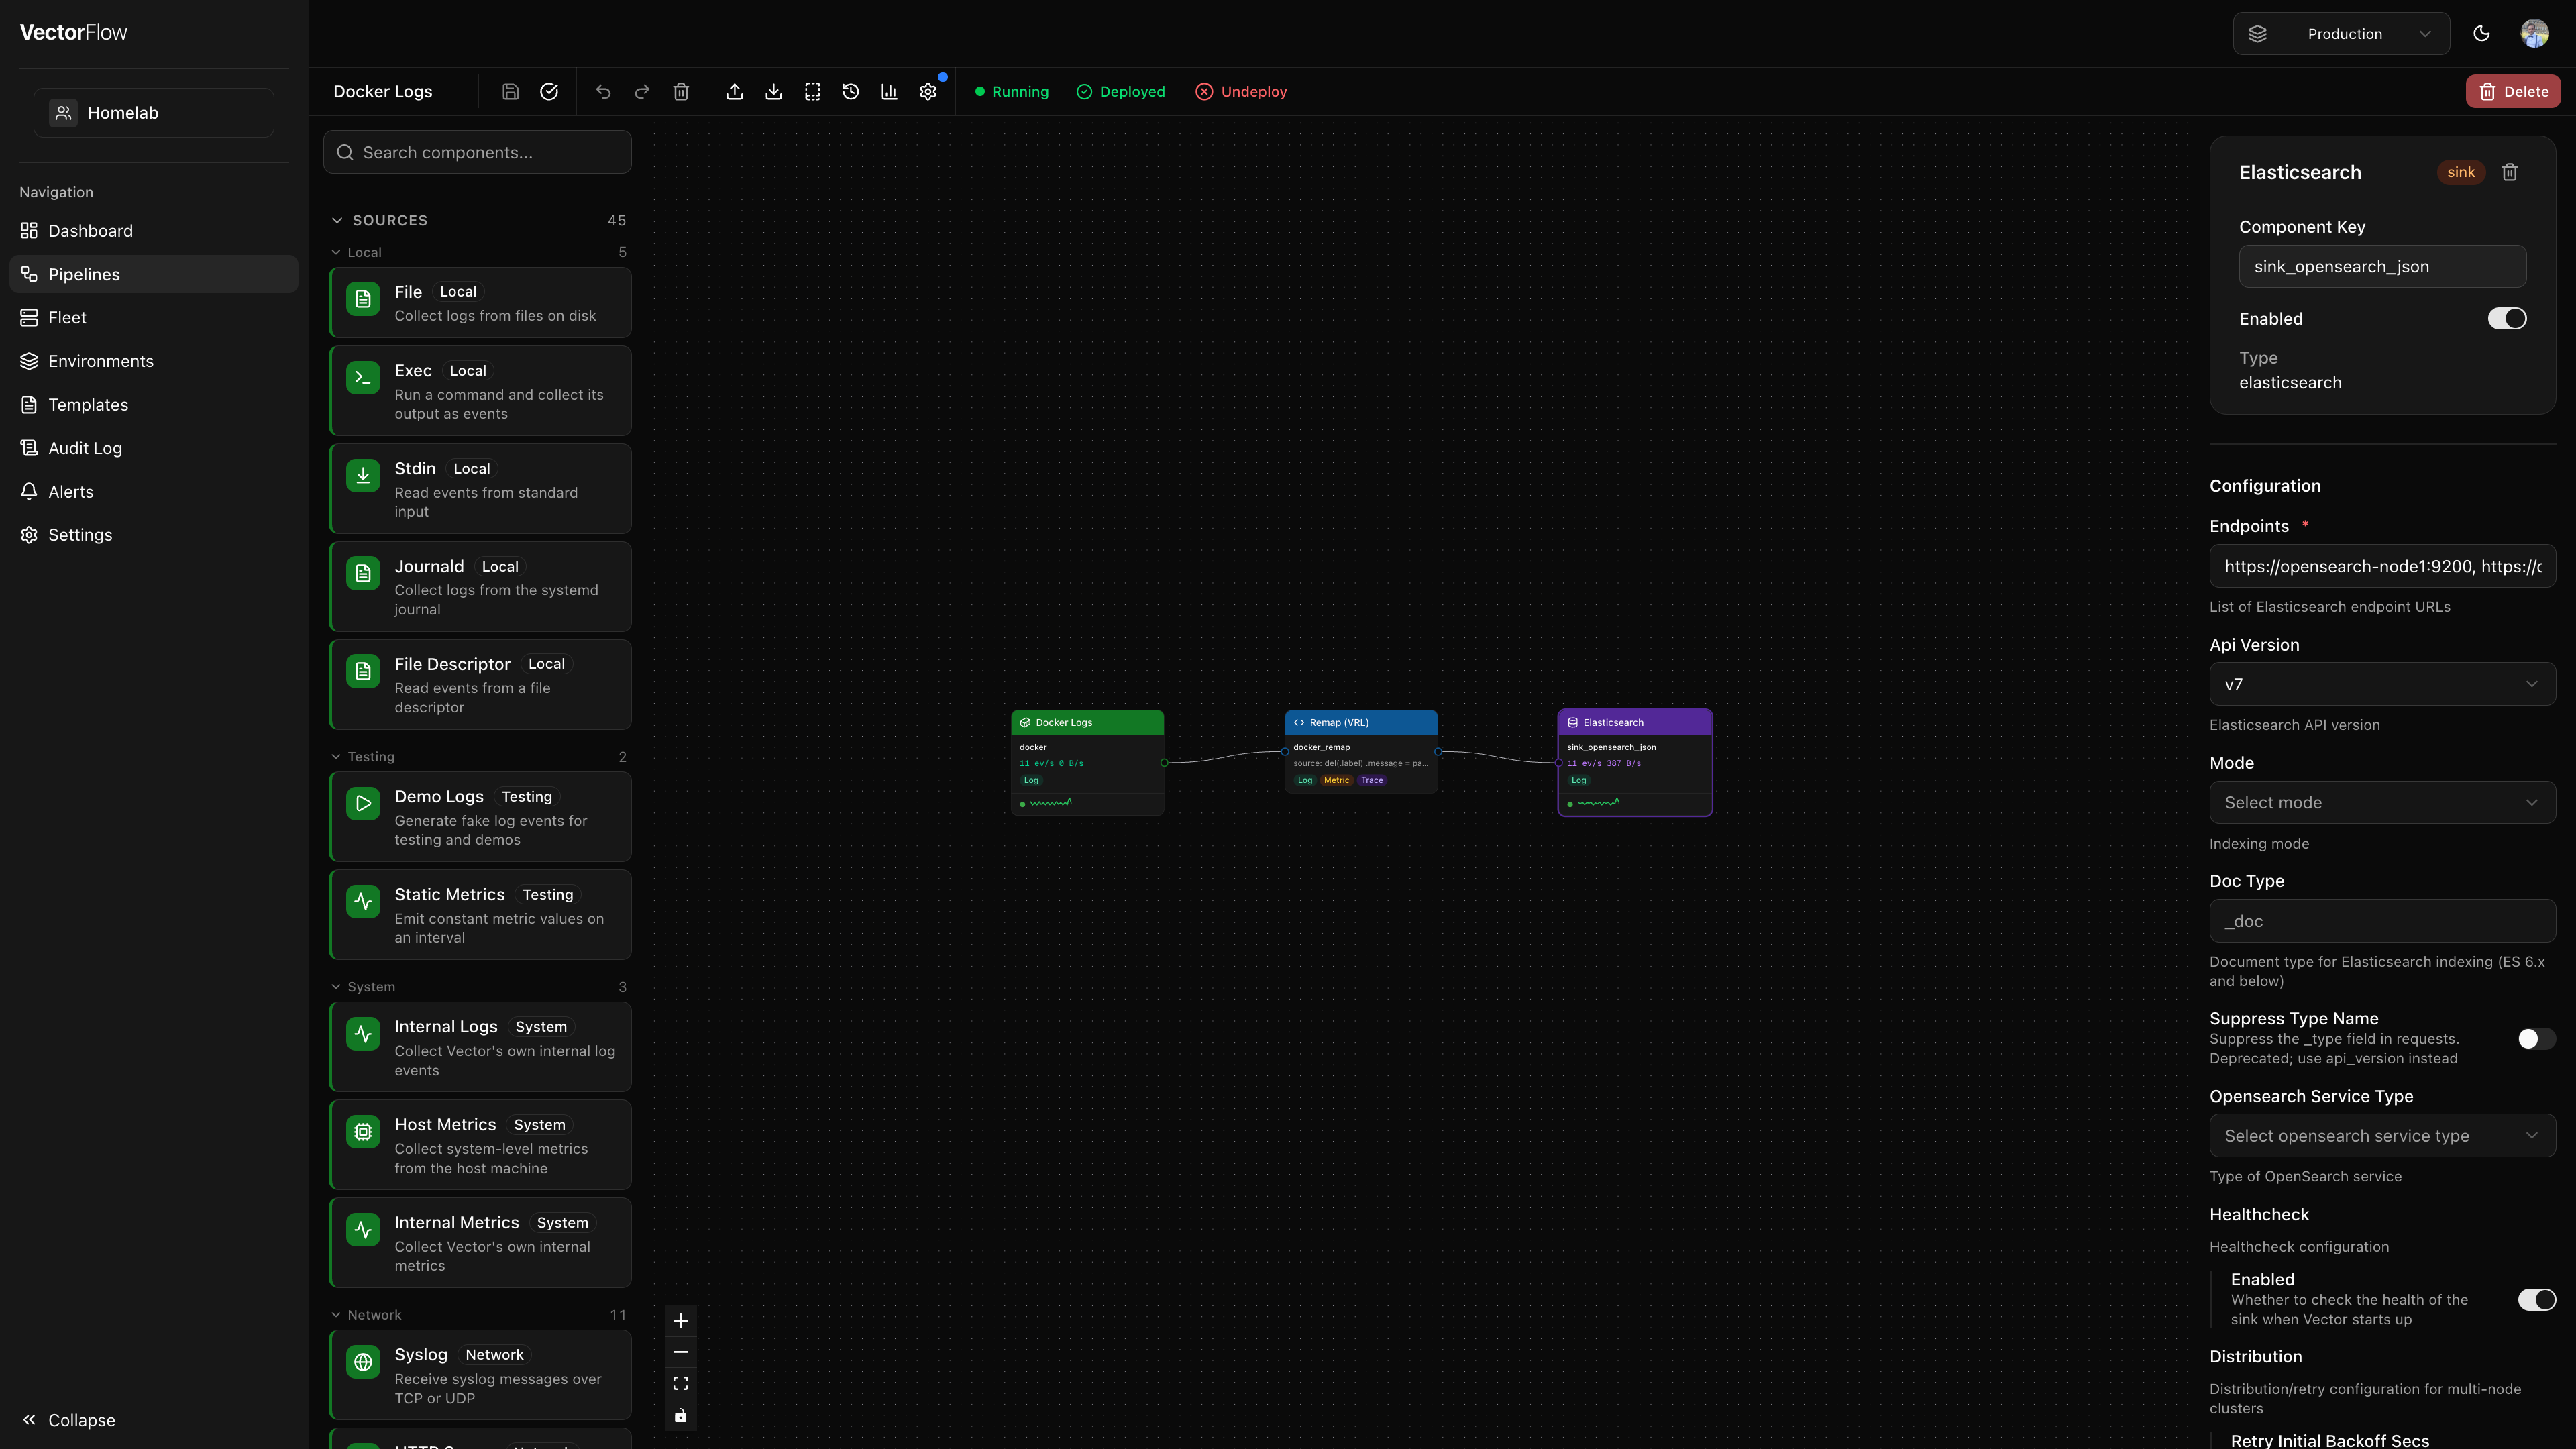
You are now in the pipeline editor -- a drag-and-drop canvas with three panels:
- Left -- Component palette with all available sources, transforms, and sinks
- Center -- Canvas where you build the pipeline graph
- Right -- Detail panel for configuring the selected node
Add a source
In the component palette on the left, find Demo Logs under the Testing category (or type "demo" in the search box).
Drag it onto the canvas. A green source node appears. Click on it to open the detail panel on the right, and set the format to json. This generates fake JSON log events every second.
Add a transform
Search for Remap (VRL) in the component palette and drag it onto the canvas to the right of your source node.
Click the Remap node to open the detail panel. In the VRL Source editor, write a simple transformation:
.message = "processed: " + string!(.message)
.processed_at = now()
This prepends "processed: " to each log message and adds a timestamp field.
Add a sink
Search for Console in the component palette and drag it onto the canvas to the right of your transform node.
Click the Console node and set the encoding codec to json. The console sink prints events to Vector's stdout, which the agent captures and forwards to VectorFlow for viewing.
Connect the nodes
Draw connections between your components:
- Hover over the output port (small circle on the right edge) of the Demo Logs source node
- Click and drag a line to the input port (small circle on the left edge) of the Remap transform node
- Release to create the connection
- Repeat: connect the Remap output to the Console sink input
Your pipeline graph should now show: Demo Logs -> Remap (VRL) -> Console
VectorFlow validates connection compatibility in real time. You cannot connect a metrics-only source to a logs-only sink, for example. Invalid connections are rejected automatically.
Name your components
Each node has a Name field in the detail panel. By default, new components are named after their type (e.g., "Demo Logs"). You can rename them to something more descriptive like "Demo Source", "Add Timestamp", and "Debug Output".
Renaming a component only requires saving the pipeline -- it does not require a redeploy. The backend component ID is auto-generated and shown as a read-only field below the name.
Validate the pipeline
Click the Validate button (checkmark icon) in the toolbar at the top of the editor.
VectorFlow generates the Vector YAML configuration from your graph and sends it to Vector for validation. If everything is correct, you see a green "Pipeline is valid!" toast notification.
If validation fails, the error message tells you exactly which component has an issue. Fix the configuration and validate again.
Save the pipeline
Click the Save button in the toolbar (or press Cmd+S / Ctrl+S). This persists your pipeline graph to the database but does not deploy it yet.
Deploy
Click the Deploy button in the toolbar. The deploy dialog opens and shows:
- The target environment and how many agents are enrolled
- A validation check (the pipeline must be valid to deploy)
- A YAML diff comparing the new config against the previously deployed version (if any)
- A Deployment Reason field -- describe what changed and why
Enter a deployment reason (e.g., "Initial demo pipeline"), then click Publish to Agents.
VectorFlow publishes the pipeline configuration. Agents pick up the new config on their next poll cycle (default: 15 seconds).
Verify
Navigate to the Fleet page. You should see your agent with an Online status. The pipeline status shows as Running once Vector picks up the configuration.
Back in the pipeline editor, the toolbar shows a green Deployed badge. If you enabled metrics, you can see live event rates on the canvas edges.
Congratulations! You have built, validated, and deployed your first VectorFlow pipeline. Demo log events are flowing through your Remap transform and printing to the console.
What just happened
Under the hood, VectorFlow:
- Converted your visual graph into a Vector YAML configuration
- Validated the config using Vector's built-in
--config-yaml validatecommand - Created an immutable version snapshot with your changelog entry
- Published the config to all agents in the target environment
- Each agent pulled the new config, wrote it to disk, and started a new Vector process
Next steps
Now that you have the basics, explore more of VectorFlow:
- Pipeline Editor -- keyboard shortcuts, import/export, templates, and metrics overlay
- VRL Snippets -- save and reuse VRL patterns across pipelines
- Environments -- organize your fleet into staging, production, and other environments
- Fleet Management -- monitor agent health, view logs, and manage nodes